

Every year, deaths by drowning increase in tandem with ice cream sales.
But anyone who’s taken psych or statistics 101 knows “correlation is not causation.” It’s all about drawing the right conclusions from the correlation. Does ice cream cause drowning? No. It’s just summertime.
A similar process is required when using correlation data in sales and marketing strategies — because it is often all we have to go on.
Say there’s a case study being associated with deals, 80% of which are closed/won and 20% of which are closed/lost. How do you know it was actually the content that closed the deal, not the rep, or the competitor, or your new digital sales room, or the customer’s boss, or the market? The reality is there are too many variables to definitively prove causation.
But correlation data is still data, and it can meaningfully inform how you create and use sales content if you measure and analyze it intelligently.
In this article, we’ll go through the three stages of sales content analytics, moving from default metrics to intelligent decision making with correlation data — so you get as close to causation as possible.
Getting started with common sales enablement metrics
For data to mean anything and to accurately measure the success of new programs, the first, most essential step is to assess where you are before putting any new processes or tracking in place.
Determine your baseline. Which metrics are you tracking now, if any, and how are you tracking them? Where do content engagement and adoption stand right now?
It’s important to do the manual work upfront to ensure automation is accurate as it scales.
Next, review common metrics and see which are available as defaults in your application. For example, Bigtincan Content Hub provides seven default dashboards that automatically track:
- How often each piece of content is viewed, shared, saved, or copied
- Who is logging into the platform
- Who is interacting with the content the most
- How much time users are spending viewing the content and which sections they viewed for the most amount of time
- What topics reps are searching for
- What formats are viewed and shared the most
- How often reps are using the search function
- What format the majority of your content is in
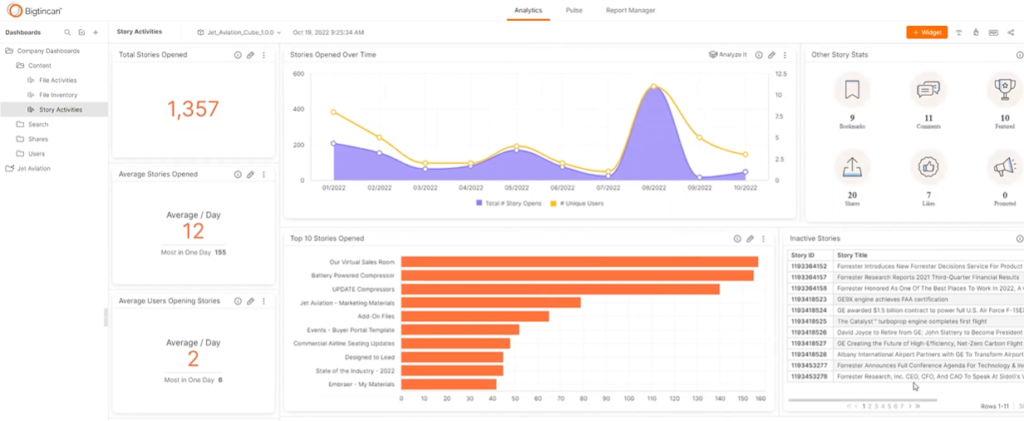
Bigtincan Story Activities Dashboard
Other common sales enablement content metrics include:
Tool Adoption
- Active Users
- Never Engaged Users
- Device Used
Content
- Viewed
- Searched
- Shared
- Interacted with by prospects
- Time on file
- Time on slide
Sales enablement platforms choose which standard reports to provide based on what their customers care about, so spend some time monitoring default metrics as a first step. It will help determine your baseline and allow you to assess how meaningful each metric is to your organization, which provides the data needed to move on more advanced analytics.
Learn how sales enablement metrics are defined, calculated, and improved in The Definitive Guide to the Most Important Sales Enablement Metrics.
Tying content metrics to sales KPIs
Once you get comfortable with standard content metrics, the next step is to understand how to correlate them with actual sales numbers, such as pipeline and opportunities created, close rate, and sales cycle length.
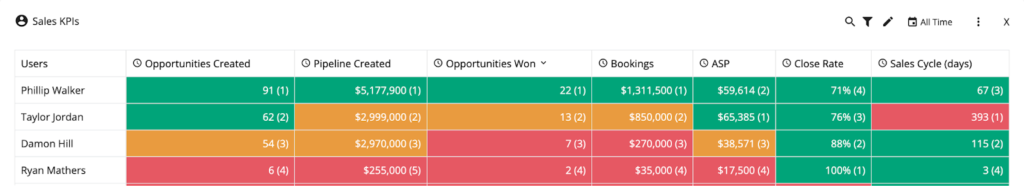
Bigtincan Sales Rep Scorecards
The key to this step is to bring in CRM/Salesforce data, which will let you compare content usage to performance in order to see which files and stories are helping close those deals as well as which sales reps are using files and stories in an effective manner.
To minimize the manual work required in this step, you will need a sales enablement solution that includes a content management tool and integrates with your CRM so you have one central system for tracking and viewing both content and sales data.
Once those systems are in place it is time to dig in. Conduct internal case studies. Look at how high and low performers use content and make those correlations between content adoption and revenue generated.
Look at deals closed over the last 6 months. Inspect behaviors like which content was shared with these clients, what they engaged with most, which content they didn’t bother to open, and which channels worked best for sharing content.
On-demand webinar: The Critical Connection Between Content and Revenue
Building strategies with correlation insights
Once you’ve been monitoring content analytics, making correlations between content and sales, noticing some behaviors and processes you want to change, you’ll have to ask, “What decisions can I make?”
Answers are not going to be the same for everyone — that’s why you need to look at your data to find trends, run tests, and hone in on the metrics that matter most to you and your team.
Some actions you can take to gather data for decision-making are:
- Look at overall trends in content
- Run an A/B test with a variable you can control and keep all others as constant as you can, like sending a video case study vs PDF case study and measuring engagement on each
- See if you can find any correlations with sales outcome or cycle length to see when certain types of content are the most successful
- Invest in content in successful areas by improving what you have or creating more
- Keep checking for trends and keep testing
You may also want to move beyond default metrics and dashboards and build custom reports. For example, you might identify the three to five metrics most closely correlated to revenue and results. Save time and manual work by putting those on a custom dashboard, tracking them in one place, and setting up automated emails and alerts.
To do this, you may need to bring in additional external data from a database or spreadsheet.
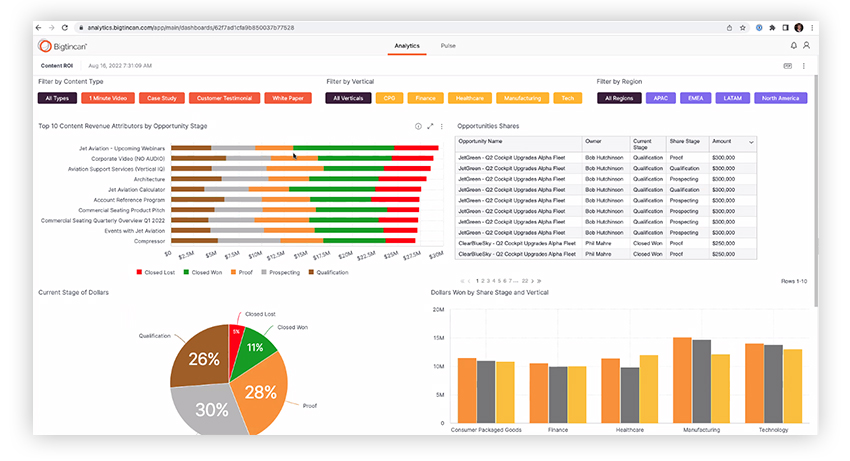
Bigtincan Custom Content Analytics Dashboard
Use these correlation insights to inform your content, sales, and sales enablement strategies. Some changes you might make based on correlations are:
- Improving existing content
- Creating additional content
- Investing in new types of content
- Retiring content that’s unused or not working
- Updating sales processes with recommended content per stage
- Training reps on how to use content
When it comes to sales content and revenue, you will never be able to prove 100% causation 100% of the time. You have to take action on the data you have. And what’s important is how you leverage correlation insights to build intelligent strategies that become the cause of your increased success.